A live data app for $0: DuckDB, Astro, and no BI tool
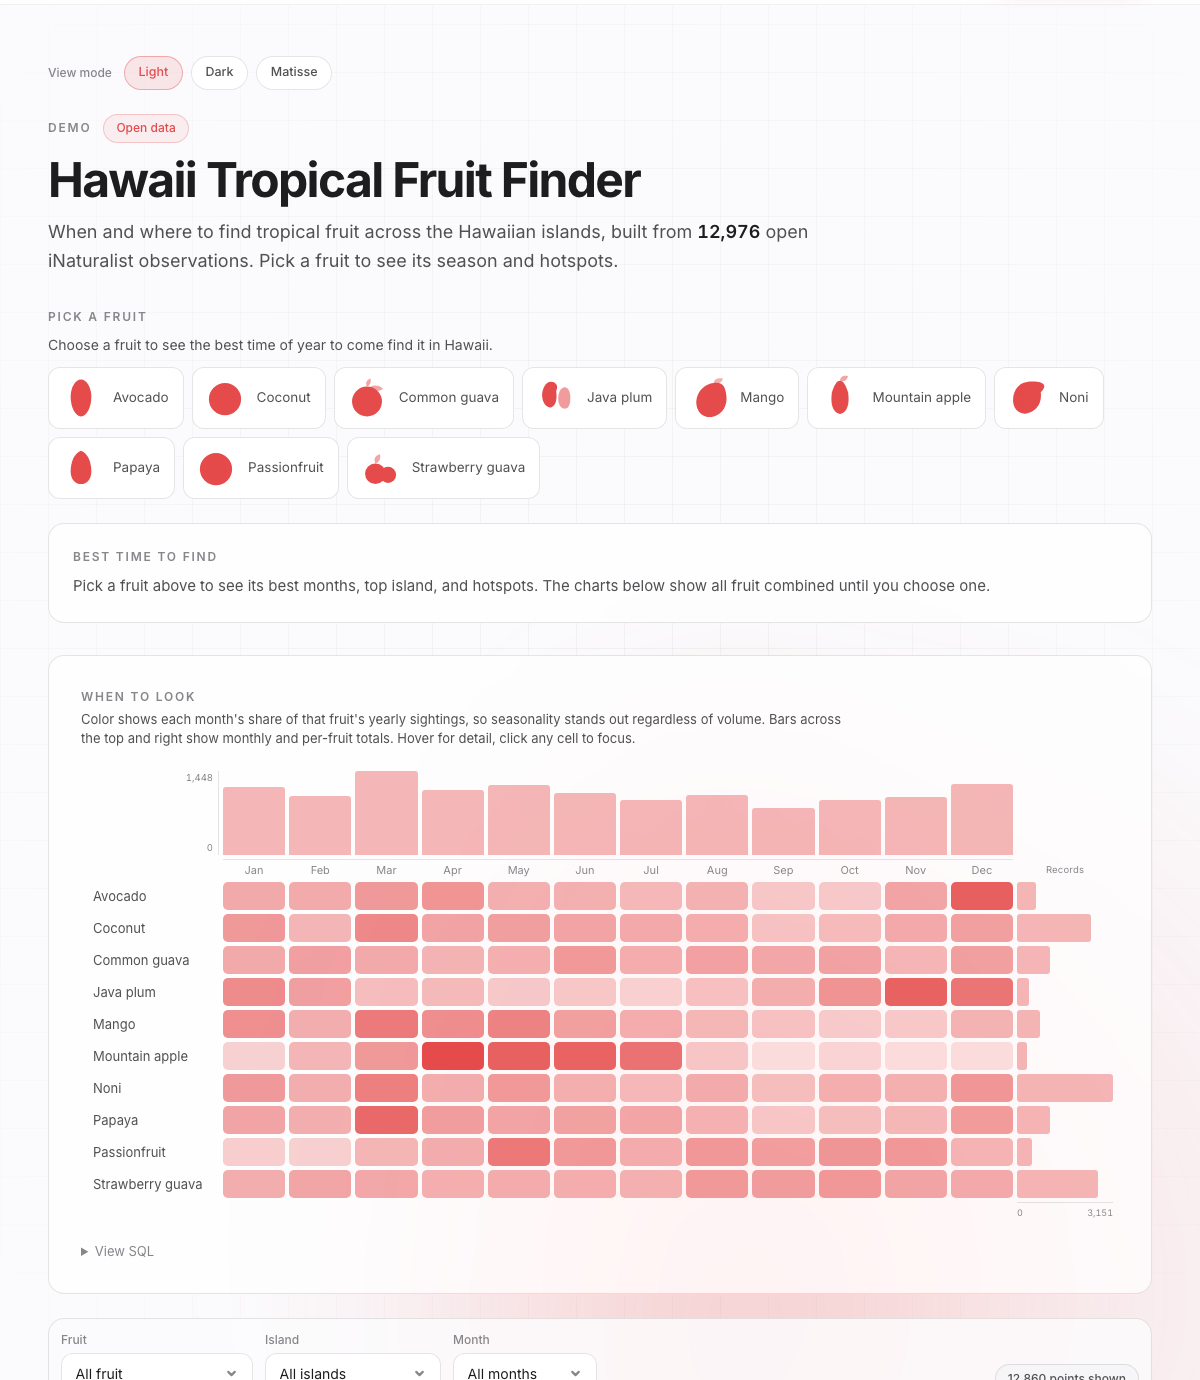
I built a small data app that tells you when and where to find tropical fruit in Hawaii. It runs on open iNaturalist data, it is fully interactive, and it cost zero dollars to build and run. No Tableau license, no warehouse bill, no BI seat. See it live here.
This post is the architecture, the tools, and an honest take on when an open-source stack makes more sense than Omni, Hex, or an old school favorite like Tableau, and when it does not.
What it does
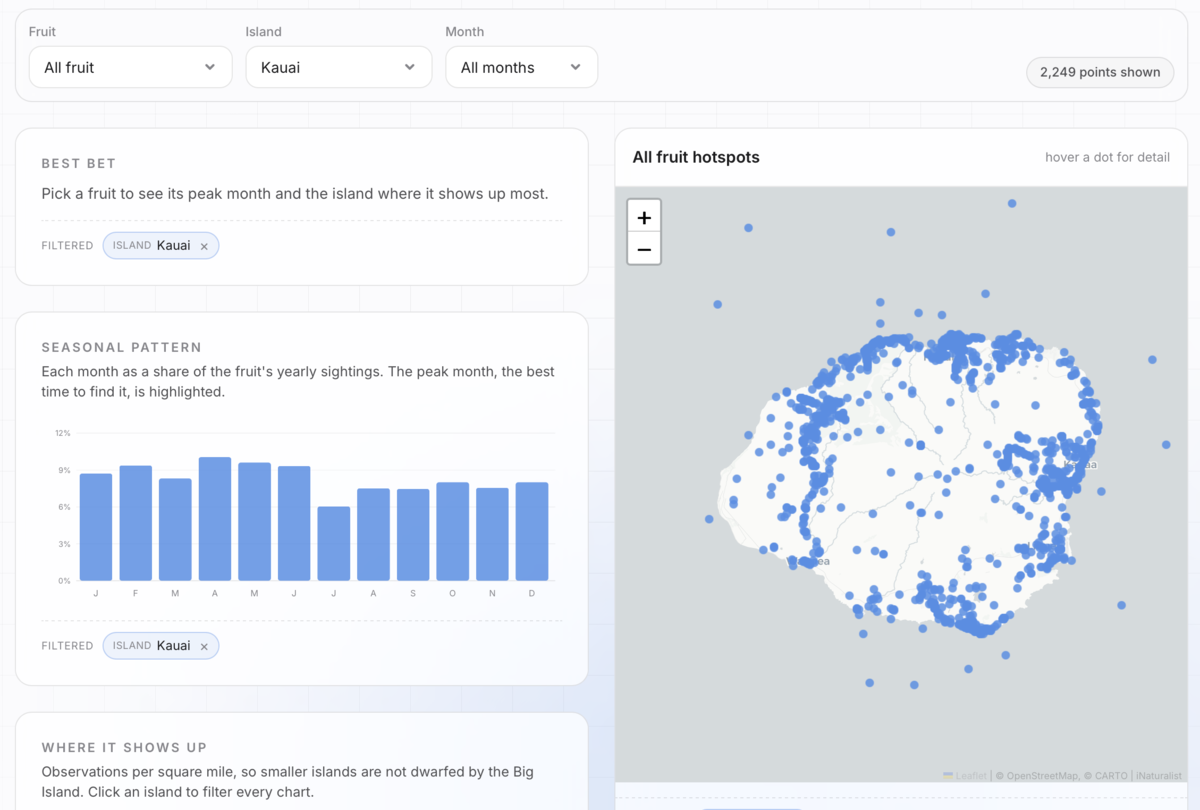
The app answers two questions for ten tropical fruits: what month you are most likely to find it, and which island. It is built from about 13,000 community observations. There is a seasonality table, a per-island density chart, and a map of every sighting. Click anything and the rest follows.
The stack (five boring parts)
Here is the entire pipeline. Every piece is unglamorous, which is the point.
- Pull. A small Python script hits the iNaturalist API (public, no key) and writes a CSV.
- Transform. DuckDB reads that CSV and runs SQL to build the marts (seasonality, island density, map points). The output is a single
data.json. - Serve. An Astro page reads that JSON. Charts are hand-rolled SVG, the map is vanilla Leaflet. No React, no chart library.
- Refresh. A GitHub Actions cron re-pulls and rebuilds every week, then redeploys itself.
- Host. It rides on spicydata.ai, a site I already run and pay for, so the app itself added nothing. It is one more HTML page plus a JSON file.
The pull is a small, throttled, cursor-paginated loop: a real User-Agent, a sleep to stay polite, and the id_above cursor to page past iNaturalist's 10k cap.
import csv, time, requests

API = "https://api.inaturalist.org/v1"
HAWAII_PLACE_ID = 11
PER_PAGE = 200

# Identify yourself, and stay under 1 request per second (iNat asks nicely).
session = requests.Session()
session.headers.update({"User-Agent": "spicy-data-hawaii-fruit/0.1 (+https://spicydata.ai)"})

def pull_species(taxon_id, writer):
    """Page past iNat's 10k cap with the id_above cursor."""
    id_above = 0
    while True:
        r = session.get(f"{API}/observations", params={
            "taxon_id": taxon_id, "place_id": HAWAII_PLACE_ID,
            "verifiable": "true", "order_by": "id", "order": "asc",
            "id_above": id_above, "per_page": PER_PAGE,
        }, timeout=60)
        results = r.json().get("results", [])
        time.sleep(1.1)
        if not results:
            break
        for obs in results:
            writer.writerow(row_from_obs(obs))
        id_above = results[-1]["id"]
        if len(results) < PER_PAGE:
            break
DuckDB is the quiet hero
DuckDB is an in-process SQL engine. Think SQLite, but for analytics. It reads the raw CSV directly, so there is no load step, no server to stand up, and no warehouse to pay for. The transform is one Python file: a handful of GROUP BY queries that turn 13,000 raw rows into the four small tables the app needs. It finishes in well under a second on a laptop or a CI runner.
Configuring it is one line. Then it reads the CSV straight off disk into a typed table, and every mart is just a GROUP BY:
import duckdb

con = duckdb.connect()  # in-process: no server, no warehouse, no bill

# Read the raw CSV straight off disk into a typed, queryable table.
con.execute("""
CREATE TABLE obs AS
SELECT
    label,
    CAST(month AS INTEGER) AS month,
    CAST(lat AS DOUBLE)    AS lat,
    CAST(lng AS DOUBLE)    AS lng,
    is_fruiting,
    quality_grade
FROM read_csv_auto('data/raw/observations.csv', header=true)
""")

# Each mart is just a GROUP BY. This one is the monthly seasonality table.
seasonality = con.execute("""
    SELECT label, month, count(*) AS n
    FROM obs
    GROUP BY label, month
    ORDER BY label, month
""").fetchall()
For a dataset this size, reaching for Snowflake or BigQuery would be like renting a forklift to carry a grocery bag. DuckDB gives you real SQL, window functions, and Parquet support, with the operational footprint of a library import. When the data does grow, the same SQL scales up to those warehouses later. You are not painting yourself into a corner.
The $0 part
Almost every layer is free, and the one that is not (hosting) is a site I already run. The data is open, the engine is embedded, and the cron is included.
| Layer | Tool | Cost |
|---|---|---|
| Data | iNaturalist API | Free, public |
| Transform | DuckDB (embedded) | Free, no infra |
| App | Astro, Leaflet, SVG | Free, open source |
| Refresh | GitHub Actions cron | Free tier |
| Host | spicydata.ai (already running) | $0 added |
Compare that to a Tableau Creator seat, an Omni plan, or metered Hex compute. For a single public data product, those bills buy capabilities you will not use here.
Themes apply to everything
The site has light, dark, and a cut-paper "Matisse" mode. Flip the toggle and it is not just the page chrome that changes. Every chart, the heatmap, the map, all of it follows.
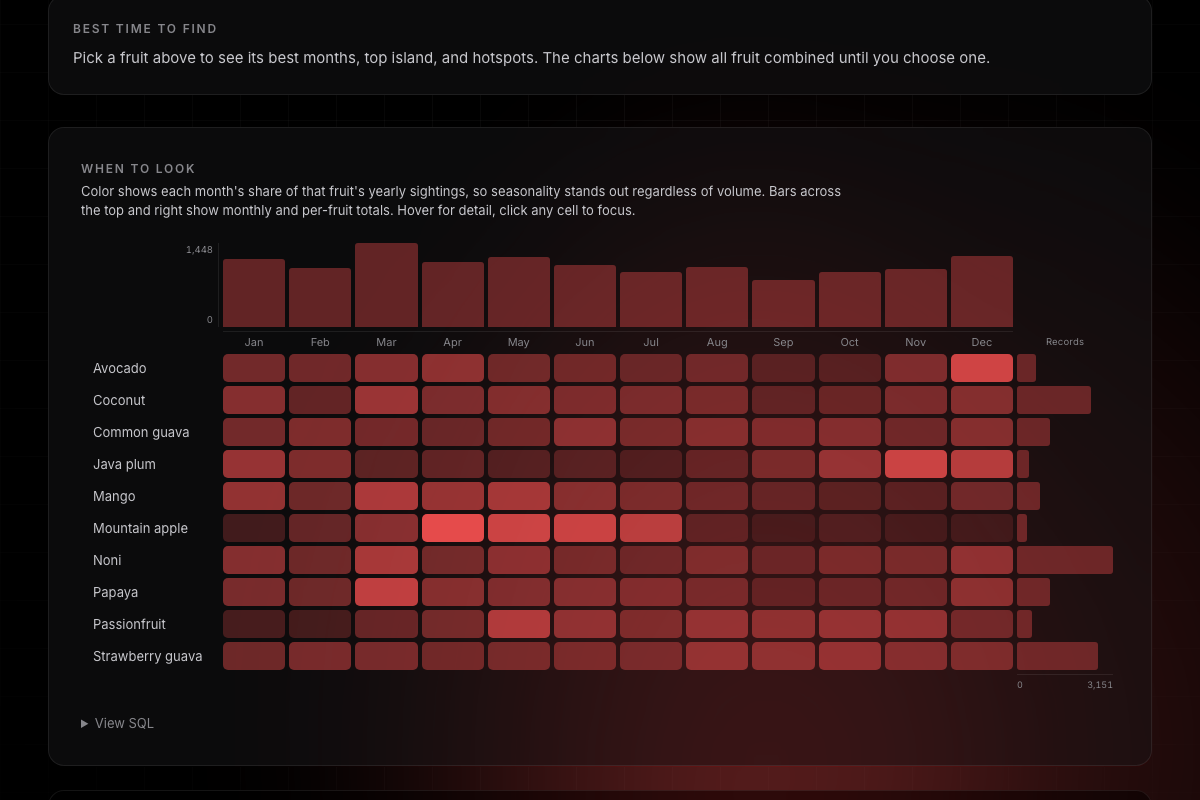
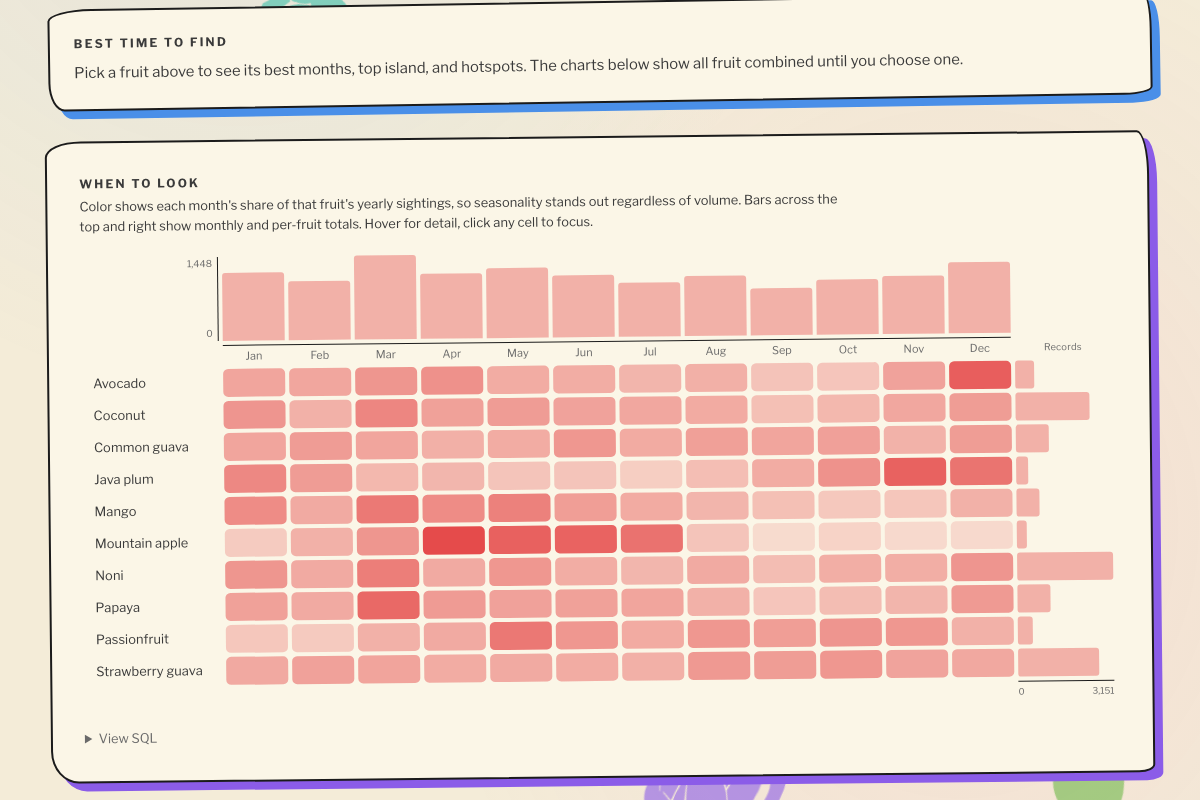
The trick is boring on purpose: every color in the app is a CSS variable. The charts read the hero color, the cells read it at varying opacity, the backgrounds read the surface token. Change the variable, the whole thing restyles for free. The one holdout was the map, since Leaflet draws its dots to a canvas and bakes the color in at draw time. A tiny observer that redraws the map when the theme changes fixed it. In a BI tool you get the tool's themes. Here the data viz is just part of your design system.
Designed to spec, in plain English
I did not drag a single pill onto a shelf. The entire interface was specified in natural language and written by Claude Code. A few of the actual asks:
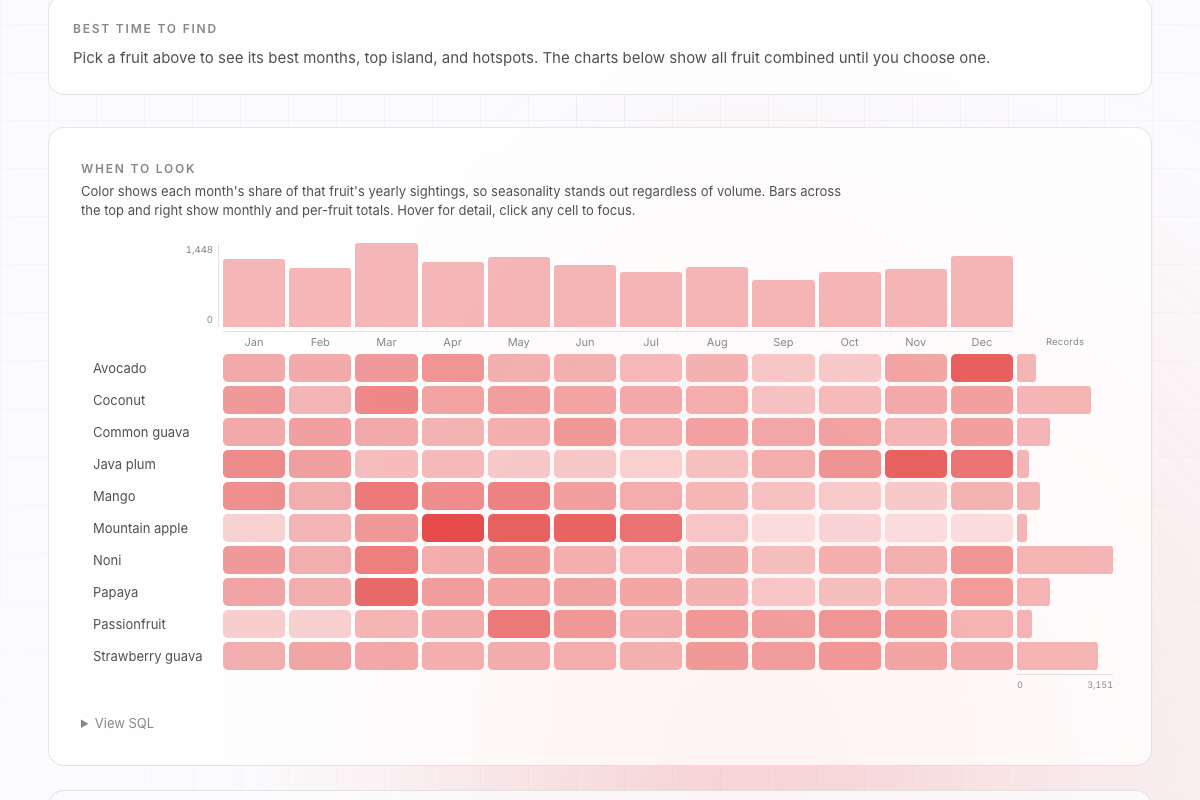
- "Make the seasonality view a marginal-bar highlight table, sorted alphabetically, cells colored by each month's share of that fruit's year."
- "Put bars and value axes on the top and the right of the table."
- "Add a breadcrumb footnote to every chart, and clicking an island should filter the whole app."
Each of those sentences became working code. That is the part the old tools cannot match. You describe the exact artifact you want, down to the interaction, instead of bending your idea to fit a chart menu and a properties panel.
Open source vs Omni, vs Hex, vs Tableau
One tool at a time. None of these are bad, they just lean into different jobs.
| Open source (this) | Omni | Hex | Tableau | |
|---|---|---|---|---|
| Cost and footprint | Lightweight, ~$0 added | Per seat | Hosted, metered | Per seat |
| Leans into | Bespoke, on-brand products | Governance, the semantic layer | Modular notebook-style apps | Drag-to-explore dashboards |
| Blends with your site | It is your site | Embedded, its own chrome | Embedded, its own chrome | Tableau's look |
| Semantic layer | Do it yourself | Built in, its whole point | Partial | Limited |
| Code and notebooks | Total, it is code | SQL plus a YAML model | Python and SQL notebooks | Limited custom SQL |
| Public sharing | Trivial, on your domain | Gated or limited | Hosted app links | Tableau Public |
| Lock-in | None, code, SQL, JSON | Seats and model | Seats and hosting | Formats and seats |
- Open source is lightweight and essentially free, and it does the one thing the others cannot: it does not embed in your site, it IS your site. The charts, the map, and the table inherit the same stylesheet, fonts, and theme toggles as every other page. No iframe, no tool chrome, no second design system to keep in sync.
- Omni leans hard into governance. Metrics modeled once in SQL and YAML, version controlled, trusted across a team. When many analysts need one agreed definition of a number, that is the entire point of Omni, and it is exactly what this little app skips.
- Hex leans into modular, notebook-style deployments. Python and SQL cells you wire into a shareable app, ideal when the deliverable is really an analysis with some interactivity bolted on.
- Tableau is the elder statesman, still great at drag-to-explore, but it does not do much of what the other three can. No real semantic layer like Omni, no notebook or code flexibility like Hex, and no way to truly blend into your own site like an open-source build. You get Tableau's look, Tableau's chart types, and Tableau's file formats.
When to reach for which
Need a team that trusts one governed definition of every metric? Reach for Omni. Need shareable analyses with code behind them? Hex. Want to drag and drop like the old days? Tableau. Need one polished, on-brand, public or embedded data product for next to nothing, with full control of every pixel and interaction? Build it. The build is cheap now, because you can describe it in plain English and let the model write the code.
The fruit app is live here. The stack underneath it (iNaturalist, DuckDB, Astro, Leaflet, a weekly cron, a free host) is the same one I would reach for to ship a client a refreshable, branded, interactive data product, with no per-seat bill in sight.
Josh
Want a refreshable, branded data product without the per-seat BI bill? This stack is the one we ship on client data. Senior talent. AI-native delivery.